GPLREP - P&L Reports
GPLREP - P and L
Overview
The P&L shows the YTD P&L at a point in time. It drives mainly from trade data and utilises valuation databases for the time point.
This report is organised by department within category (WIPCODES/Category are assigned to DEPT).
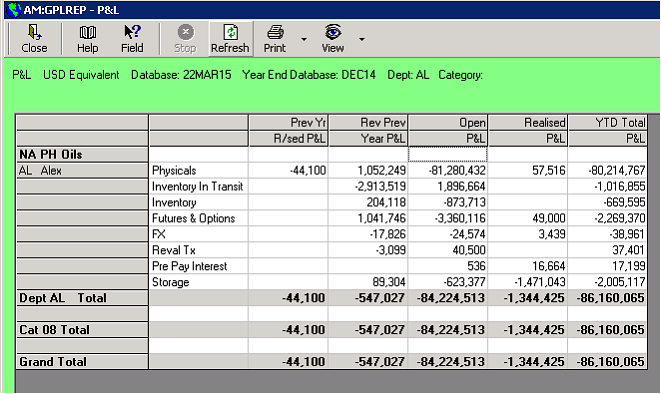
The output may be presented on a grid as above, or to a pivot table or to excel.
Open P&L and Realised P&L Columns
Physicals
‘Physicals’ consists of the Physicals, Inventory in Transit and Inventory rows.
This data comes from the database selected
| | Row | Column | Content |
| | Physicals | Open P&L | TRADE contracts with a blank TT date i.e. forward |
| | Inventory In Transit | Open P&L | This cell comprises 3 data types: 1) TRADE contracts which have a TT date but no delivery date or warehouse date i.e. ownership has passed from the supplier; but the goods have not yet arrived at a terminal 2) PROMAN Stock which is in transit between 2 terminals; an ‘Internal transfer Out’ has been completed at origin, but the ‘Internal transfer in’ at destination has not been completed. 3) PROMAN stock has left the terminal in transit to a customer; but ownership has not yet passed to the customer. |
| | Inventory | Open P&L | This cell comprises 2 data types: 1) PROMAN Stock in a terminal or 2) TRADE Stock i.e. a record with a TT date and a warehouse date |
| | Physicals | Realised P&L | Sales contracts with a TT date in the current financial year and the PROMAN stock or purchase contracts allocated to the sale |
The open P&L columns are mark to market; converting to the target currency at the database date and only including costs flagged as ‘In P&L’.
The realised P&L column is the sales value minus the value of its allocated stock; it is converted to the target currency at the TT date and only including costs which are to be actualised i.e. not flagged as ‘No Act’.
Futures & Options
The Futures and Options Row does not use the valuation database; but applies the valuation database date to the trade date and settlement document date to the current open and settled tables:
i) trades with a trade date after the database date are excluded
ii) trades with a settlement date (document date) <= the database date and >= the start of the financial year are treated as settled.
As for Physicals; open P&L is M2M whereas realised is the trade value.
Fx
The Fx columns are the M2M of the FX trade; the settled column consist of FX deals which matured in the financial year and compares the settle currency equivalent as at the maturity date to the traded settle equivalent. The Open P&L column is the m2M forward FX deals
Reval Tx
Open P&L is the revaluation of non target currency unmatched client transactions revalued to the target currency as at the database date i.e. similar process to REVALX.
Realised is the FX gains/losses transactions as a result of matching in the current financial year.
Pre Pay Interest
Open P&L is the interest accrued on prepayments whereby the invoice has not yet been raised. It drives from unmatched client postings with the nominated prepayment expense codes. The interest rate is maintained on the TRADE record (JV tab).
Realised P&L is the interest which has been posted. It is derived from the accounting transactions posted in the current financial year in the nominated interest accounts and nominated expense code.
Storage
Open P&L is accrued storage costs. It is derived from inventory which has a tariff maintained (PHYSRATES/Storage fees) but which have not yet been invoiced.
Realised P&L is storage costs which have been invoiced in the current financial year. It is derived from nominal P&L accounting transactions with the nominated expense codes.
Prev Yr R/sed P&L Column
This column shows any movement in contracts which were realised in the previous financial year (i.e. sales TT date in the previous financial year) between the end of the financial year and the report date. For example if a contract was realised on 01Dec14, but yesterday a demurrage cost was added (to the current database)
Rev Prev Year P&L Column
This is the Open P&L as at the end of the previous financial year. It is derived from and takes its dates from the year end database. The resulting P&L is reversed signed to provide the true P&L movement for the current financial year.
YTD Total P&L Column
The sum of the all columns to provide the P&L YTD.
GPLREP – Daily P and L Movement
Overview
The Daily P&L Movement shows the change in P&L over time. It drives mainly from trade data and utilises valuation databases for the time points.
This is a report organised by department within category (WIPCODES/Category are assigned to DEPT).
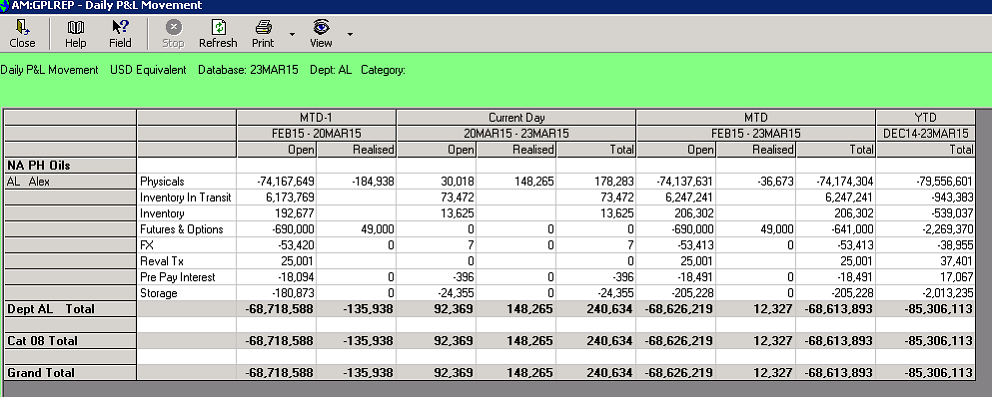
The output may be presented on a grid as above, or to a pivot table or to excel.
The formulas for data extraction are exactly the same as for the P&L; it then subtracts the 2 life to date P&Ls to get the P&L Movements.
If no comparison database is selected it shows the following movements:
EOM to Date-1
Date-1 to Date
EOM to Date
EOY to Date
Where:
Date is the selected database
Date-1 is the database for the previous working date
EOM is the database for the preceding end of month
EOY is the database for the preceding end of year
In the above example the selected database is 23Mar15.
Previous working day is 20Mar15
Preceding end of month is Feb15
Preceding end of year is Dec14
You may also select a comparison database in which case it just compares the 2 databases; for example to do a weekly P&L movement
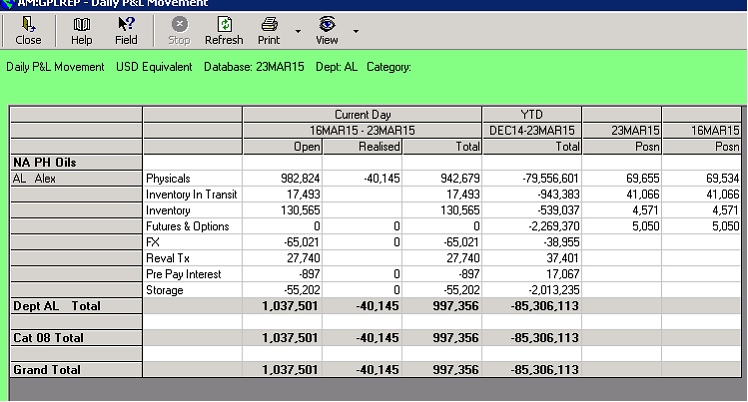
The front grid displayed above gives the overall P&L movement. The drill down provides additional analysis of the movement. The formulas behind this are shown at the bottom of the drill down report.
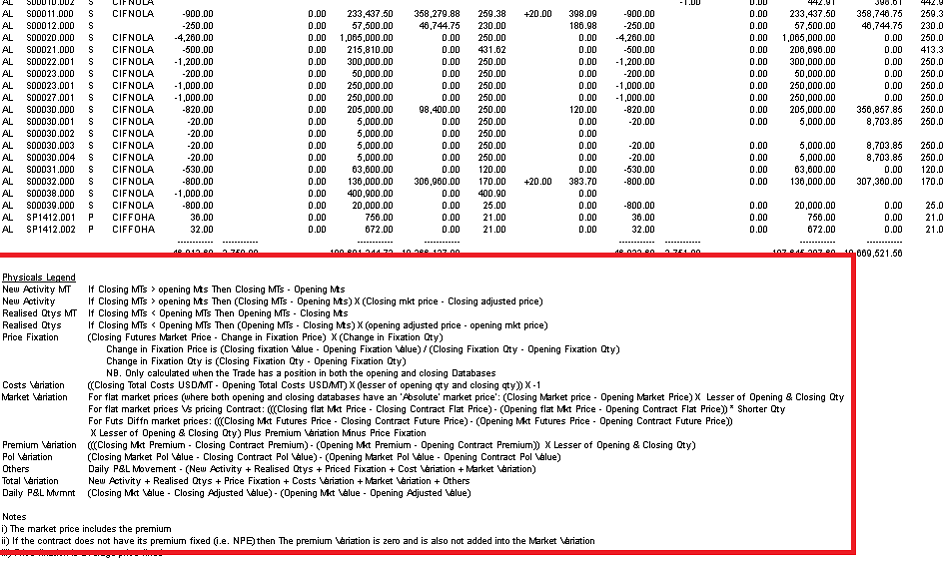
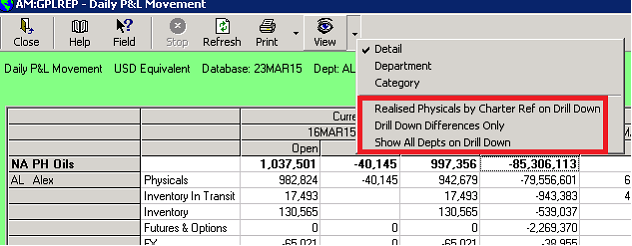
There are various options on the view button to modify the presentation on drill downs:
