Data Portal
![]()
Overview
The ITAS Data Portal is a platform for analytics and workflow development. It includes:
- a personal dashboard for organising data views or insights on key information - think “contracts ready to invoice”
- access to document management features
- launch point for centralised reports and business intelligence tools
- administration tools for managing workflow activities and the ITAS environment
Combining the features of Trader Desktop with the versatility of the Web Portal platform, the Data Portal will over time become the principal tool for navigating ITAS functions and data. It will provide access to core ITAS data, documents and reports and being web-enabled, will allow anywhere access on any device (certain restrictions apply).
Components
Data Grids
The principal component within the Data Portal is the Data Grid which will be the focal point for reviewing core business data, document management data and reporting and analytical data. All grids will have common functions such as search/filtering, as well as customisable layouts.
Most pages will contain a Data Grid and these are accessed through the Navigation Window. They are grouped logically and shown as folders. For example, within the Data area, each folder represents a Data Entity and, depending on subscription, will contain either one or multiple pages (Data Views).
Data Views
A Data View can be defined as a record set, in that it will represent a subset of data that resides on a specific table of information. An example could be Physical Trades; a Data View could show all contracts or it could show those filtered by a nominated commodity. NOTE: Core users will be restricted to All Records but will be able to define their own Layouts.
Data Views can be configured for use within the Data and Docs areas, providing a means to customise your companies view of its data and documentation.
The Reports area also implements Data Views and these pages are organised into related functions. Unlike the Data area which primarily deals with raw business data, Reports will contain an element of business logic. Users familiar with ITAS Trader Desktop will recognise these as reports from menu options such as TRADEQ.
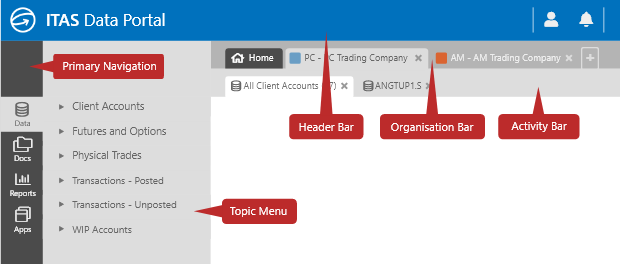
Navigation
The framework has been designed to promote re-usability to allow users to quickly gain an understanding of each of the components.
The Primary Navigation provides access to the activities within the 3 core ITAS categories; Data Management, Document Management and Report Management. Each category has a menu that lists its associated topics and the activities (referred to as Data Views) available for each of them.
The Organisation Bar identifies the Trading Entity used for the ITAS Data Views displayed in the main content area. Multiple Trading Entities can be requested using the 'plus' icon to the right of the tabs, enabling you to view comparable data for each company.
The Activity Bar show content related to the selected Trading Entity. As a 'topic' is selected a new tab is added to this Bar for simple navigation.
Customers with bespoke applications can configure the menus and accessed their content via the Apps section and in most cases, will follow the same model, i.e. principal grid with Data Views and context-driven functionality.