

Reporting and Business Intelligence (BI)
Overview
Business intelligence comprises the strategies and technologies used by enterprises for the data analysis of business information. BI technologies provide historical, current and predictive views of business operations.
ITAS provides various means of extracting this business information allowing users to adopt their own strategies and technologies (reporting applications). This is primarily achieved by utilising the Data Warehouse service.
For an overview of the relationship between the ITAS data and the reporting/analytics technology read this guide provided by Microsoft.
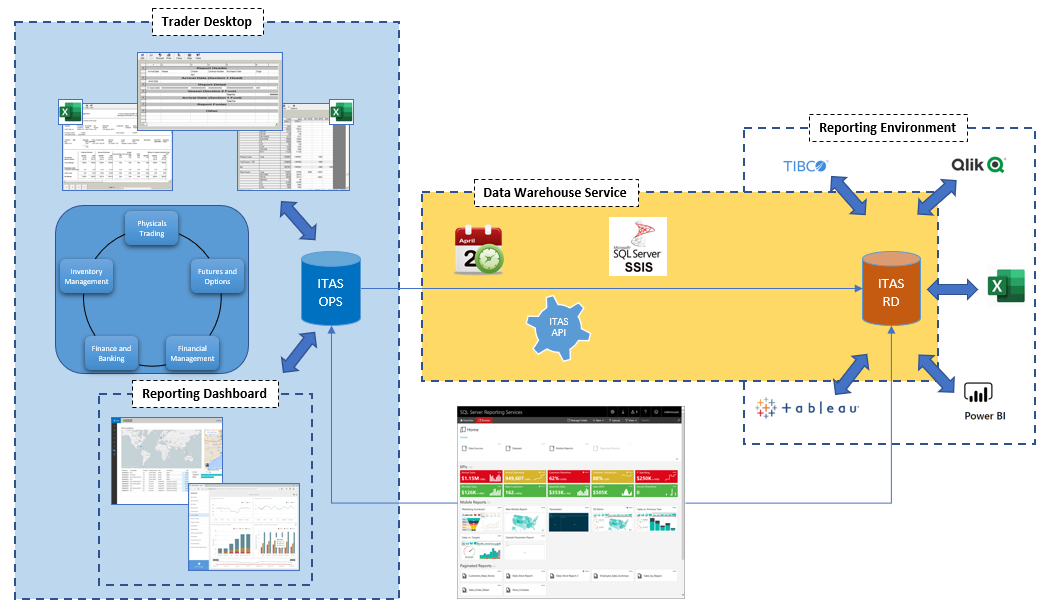
Figure 1: ITAS Reporting schema
Sample Technologies
Microsoft SQL Server Reporting Services (SSRS)
"SQL Server Reporting Services is a solution that customers deploy on their own premises for creating, publishing, and managing reports, then delivering them to the right users in different ways, whether that's viewing them in web browser, on their mobile device, or as an email in their in-box"
Further Information
Tableau
"Tableau Desktop is a report development tool for creating reports and formatting the data into visualisations. These visualisations can be organised in a dashboard for individual use or shared via Tableau Server."
Further Information
Qlik
"QlikView is designed to let you rapidly build and deploy interactive, guided analytics applications and dashboards using a flexible development environment."
Further Information
Microsoft Power BI
"Power BI is a business analytics solution that lets you visualise your data and share insights across your organisation, or embed them in your app or website."
Further Information
Integration with Trader Desktop and Web Portal
All modern reporting technologies provide accessibility via the web, with many hosting services either on-premise, in the cloud or offering a hybrid approach. Access to ITAS data is an important factor in the approach adopted.
In most cases the reports built can be accessed via the reporting tool's own portal and links can be added to Trader Desktop and Web Portal for convenience, meaning users can view/use reports without needing to go via a separate browser.
For a truly integrated Solution within Trader Desktop (applying filters and security permissions managed within ITAS) we offer the Reporting Dashboard service which supports development of bespoke, visual data representations with the option to drill-down to the underlying data. This is suitable for more dynamic reporting as it can use the Operational Database, rather than data extracted to the Data Warehouse. Again this will depend on requirements; live versus 'point-in-time' reporting.
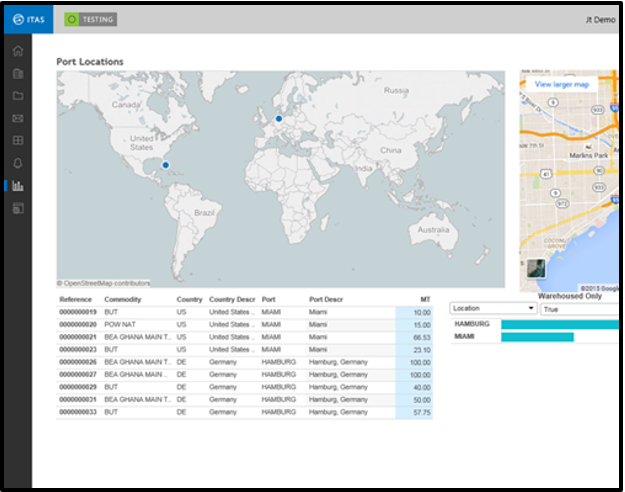
Figure 2: Sample Dashboard